

- Global CO2 emissions crept up by 0.9% (about 320 MT) to a new record high in 2022, according to a new report from the International Energy Agency – a slower growth than that of the economy, and thus perhaps a sign that renewable energy is starting to make a dent on carbon emissions. But do direct measurements through satellite observation support this finding?
- Like other global ”stocktakes”, the IEA’s is based on emission factors applied to a myriad government statistics on energy use and economic activity, plus data on heating and cooling degree days. To a large extent, the stocktake is only as good as the underlying data.
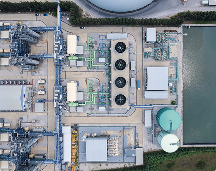
- A novel approach consists in using satellite imagery and other remote sensing techniques to directly measure high-emitting economic activity, from which associated CO2 emissions can be estimated independently of company and governments reports. Kayrros successfully applies it to a growing number of sectors and geographies, including all regulated sectors of the EU, as well as the UK and U.S., and all top carbon-intensive sectors of China: power generation, cement, steel and domestic aviation. How do the two approaches compare?
- To a large extent, the answer hinges on China, whose statistics have never been more uncertain than in 2022, when they showed both strong growth in overall coal demand and outright contraction or weak growth across all main coal consuming sectors. Kayrros measurements show emissions from the Chinese sectors it tracks plunged by an aggregate 520 MT, or more than 5% – a steeper decline than implied by official statistics.
- All other things being equal, the difference suggests global CO2 emissions could have inched downwards last year, not upwards as reflected in conventional stocktakes.
- While a decline in emissions might sound like good news, a drop due to stringent Covid-related measures could be more worrisome than it appears if it sets the stage for a steep rebound following the lifting of these measures, and thus for much faster growth in overall emissions than expected in 2023 – despite the continued buildout of renewable energy capacity.
Satellite data show China CO2 emissions plunged in 2022 in all key sectors
Figure: China CO2 emissions by sector based on satellite data analysis (Annual percentage change)
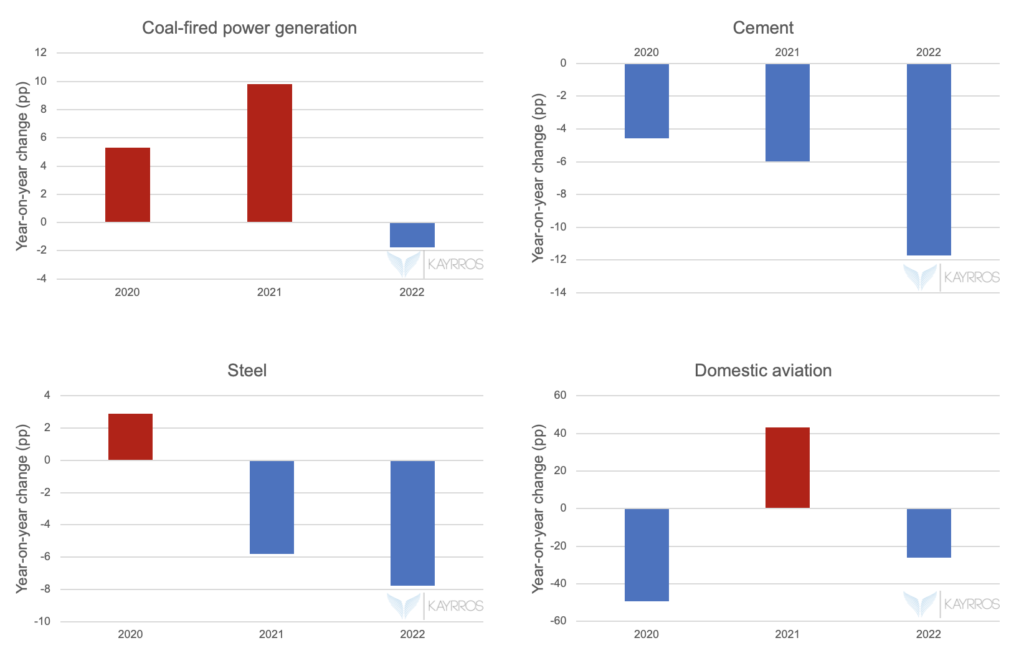
Kayrros analysis of satellite data show Chinese carbon emissions fell far more steeply in 2022 than suggested by official statistics and conventional CO2 emission assessments based on them.
- Last year’s drop spanned all key energy-intensive sectors monitored by Kayrros: coal power generation, cement and steel (monitored via satellite imagery) and domestic aviation (monitored through ADS-B signals).
- Kayrros reckons emissions from power generation fell by ~ 110 MT and those from industry by 390 MT.
- In contrast, the IEA, based on official statistics, reckons power generation emissions increased by 90 MT and fell by “only” 160 MT from industry. Kayrros measurements are 200 MT lower than the IEA’s for power generation and 230 MT lower for industry.
- In some sectors, the decline in emissions measured by Kayrros continued a trend. Thus, cement emissions have been continuously contracting for the last three years, but the pace of decline nearly doubled in 2022. Likewise, steel emissions, after initially rising in 2020, have since been on an accelerating downtrend.
Aggregate CO2 emissions from key Chinese sectors fell by > 5% last year
Figure: Kayrros China CO2 emissions aggregated index
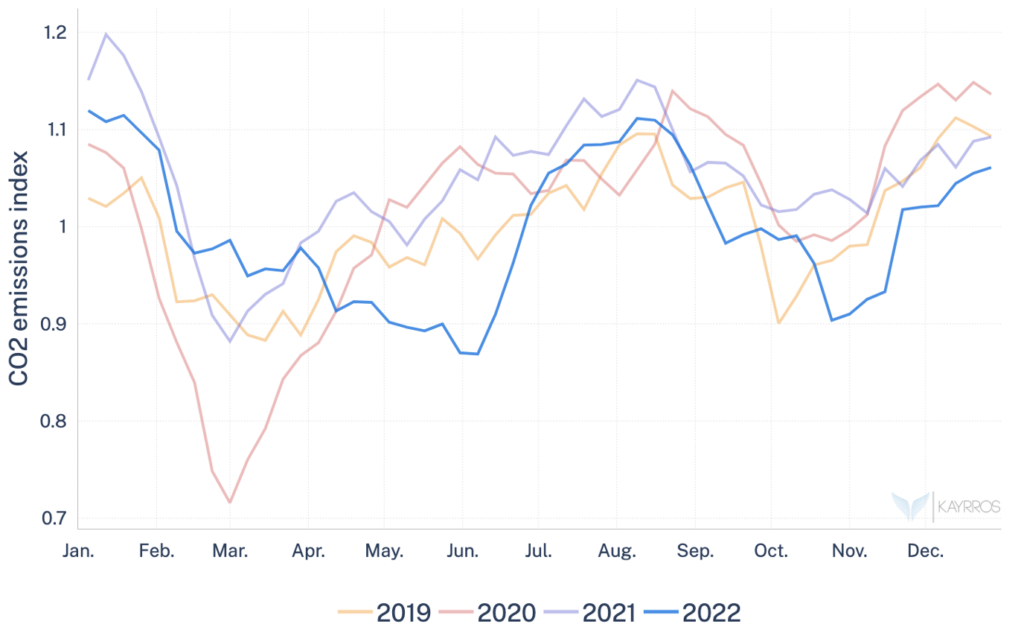
In aggregate, analysis of satellite data shows CO2 emissions from all energy-intensive sectors of the Chinese economy monitored by Kayrros plunged by 520 MT or 5.20% last year, compared with the IEA assessment of a 0.2% dip in Chinese emissions. While that estimate covers China as a whole, the four sectors tracked by Kayrros loom large in China’s overall footprint and account for most of the annual change.
- Commentators and analysts often call Chinese official statistics into question, and this was especially true last year when there were unusual delays in releasing certain economic data – hence the value of direct satellite measurements. In particular, environmental scientists and researchers took note of a seeming contradiction in 2022 data between official reports of relatively robust growth in overall coal demand and of outright contraction or much slower growth in all key coal-consuming sectors.
- A large difference in the assessment of China’s footprint carries obvious implications, given the size of the Chinese economy, for the global carbon stocktake. If the aggregate drop in Chinese emissions measured by Kayrros were to be extrapolated to the whole Chinese economy, the difference with the IEA estimate, all other things being equal, would translate into a notable decline in global carbon emissions, compared to the IEA assessment of 0.9% growth.
Other regions show differences between satellite CO2 measurements and projections based on official data
Figure: EU total ETS Emissions
Differences in emission estimates between satellite-based measurements and estimates derived from emission factors may also be found in other regions. In Europe, where Kayrros tracks all CO2 regulated sectors, Kayrros reckons CO2 emissions rose by 1.9% last year, rather than fell by 2.5% as suggested by the IEA.
- Rising gas prices following Russia’s invasion of Ukraine sent industrial emissions, notably of cement and steel, even lower than they had been in 2020, at the peak of the Covid lockdowns. But these declines were more than offset by gains in emissions from both coal- and gas-fired power generation, as well as steep growth in domestic aviation and road transportations.
- Kayrros realtime estimates of European emissions compare extremely favorably with data collected by the EU for all carbon-regulated sectors, however these data are published with a considerable lag.
In turbulent times, direct observation cuts through the noise
The difference between the assessments of China’s CO2 footprint derived from satellite imaging and from official data for 2022 exceeds in scope the IEA’s overall estimate of growth in global carbon emissions. All other things being equal, a steeper drop in Chinese emissions than reflected in official data would be enough to push the assessment of the global carbon footprint from growth to decline.
- It would also suggest that China’s stringent zero-Covid policies may have played a larger role in curtailing overall emissions last year than the global expansion of wind and solar PV power generation capacity. This could lead to a stronger than expected rebound this year following the lifting of China’s Covid measures.
- At times of rapid shifts in industry and market turmoil, direct measurements through satellite observation consistently prove a more reliable way of monitoring supply chains and the climate footprint than official statistics, which typically struggle to keep up with the change. It is also much faster. Kayrros assessments of carbon emissions are realtime, and its 2022 stocktake was available on January 1st, months ahead of conventional reports.