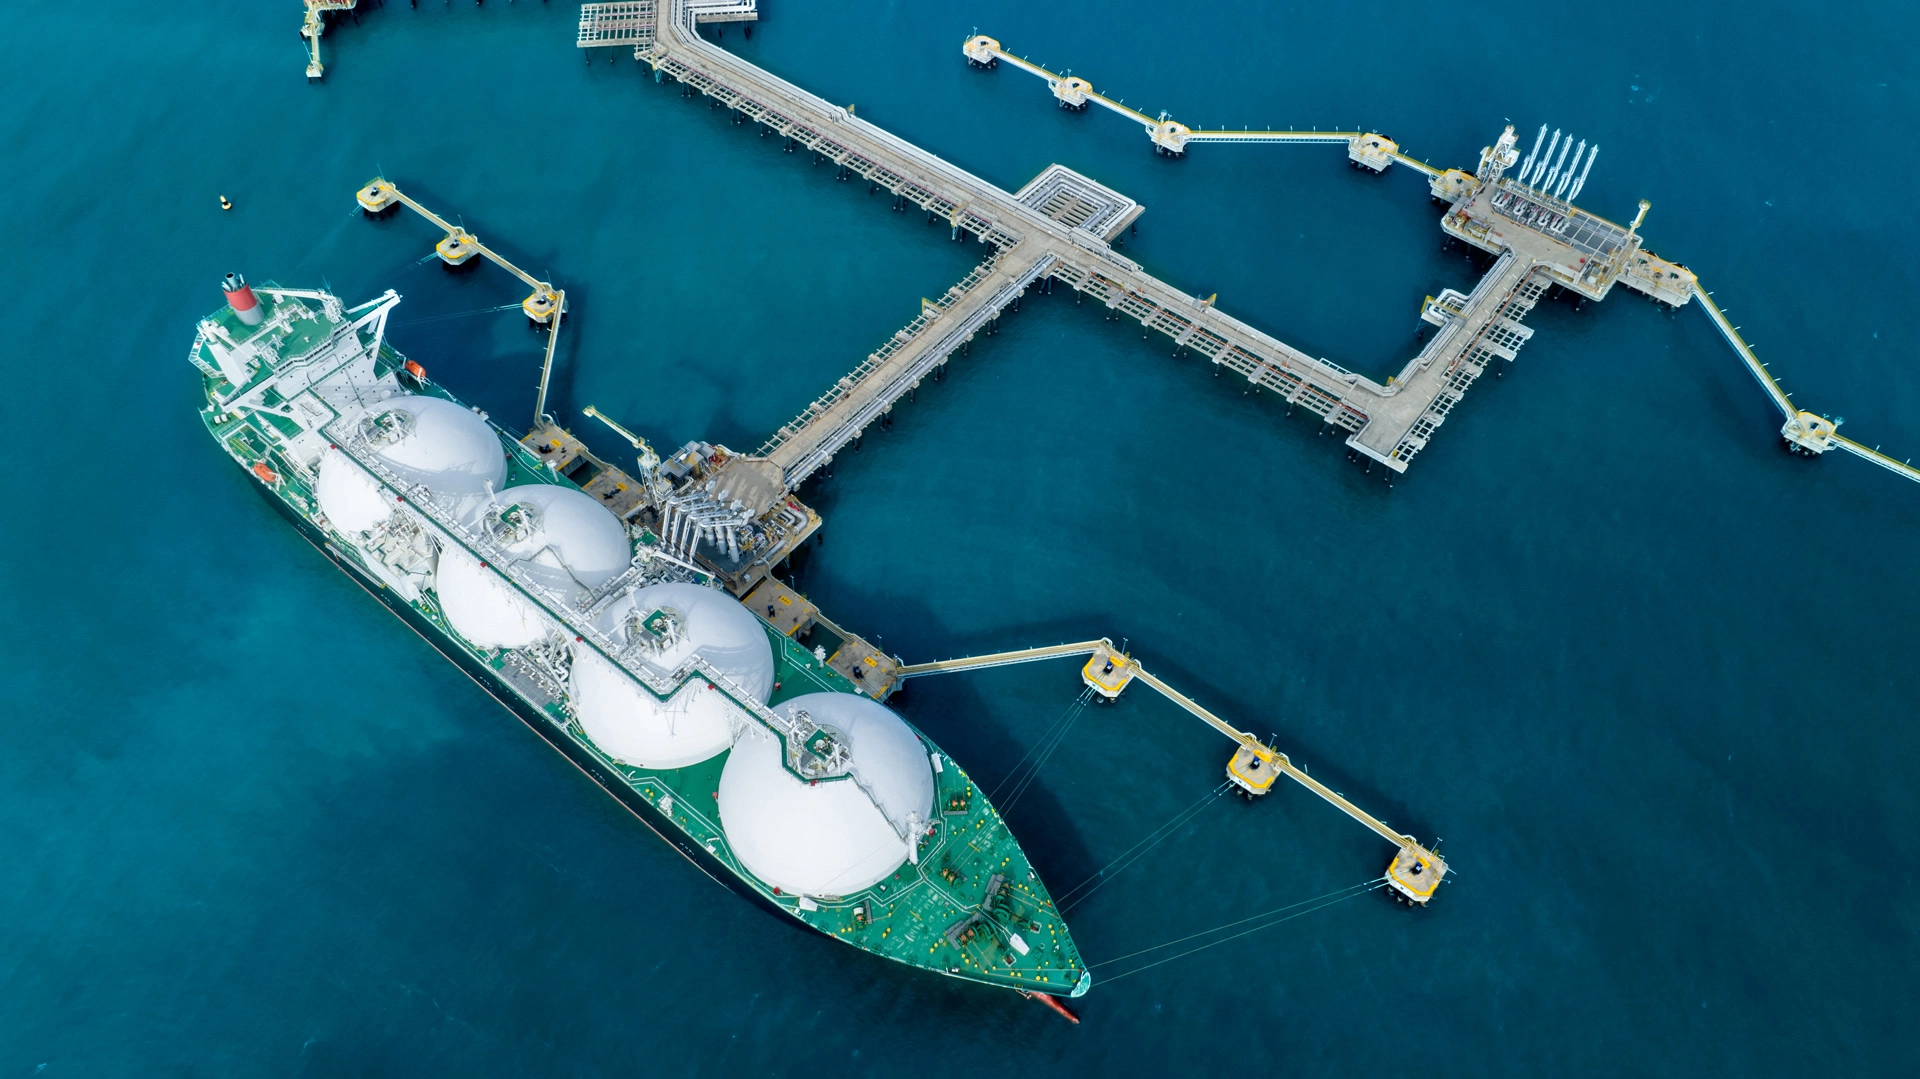
- Kayrros monitoring shows signs of restart at Freeport LNG’s long idled 15 MTPA (2.2 Bcf/d) Quintana Island liquefaction and export facility near Freeport, Texas, one of the world’s largest LNG terminals. The plant had been crippled by a fire and explosion on June 8.
- Expectations of the restart had been repeatedly pushed back since August 2022.
- The restart is bullish for US gas markets but bearish for European and global LNG markets, which have been severely tightened by the invasion of Ukraine and the subsequent loss of Russian gas supplies. The plant accounted for roughly 20% of US LNG exports before the explosion.
- LNG supply is inherently prone to disruptions. Accidents and unplanned maintenance are a common occurrence at LNG terminals around the world and a major driver of market volatility. Kayrros proprietary data show that 32% of the world’s LNG plants, accounting for 55% of global liquefaction capacity, experience unplanned outages more than five times a year for a total of 90 days per facility on average.
- Gas and LNG markets have been on a roller coaster since the invasion of Ukraine. LNG prices hit all-time highs on the loss of Russian supplies, only to fall more recently on a late start of the 2022-23 winter, cutbacks in European industrial use, and higher European LNG imports, notably from the U.S. China’s reduced imports last year also helped stabilize the market.
- The outlook for European gas supplies remains far from assured. Climate change makes the weather more unpredictable than ever and subject to huge swings in temperatures and rainfall, and thus hydroelectricity supplies. China’s reopening could signal a return to higher LNG imports. And high utilization rates at LNG plants only increases the risk of unplanned maintenance and outages. More than ever, close satellite monitoring is needed to stay on top of market shifts.
An LNG giant reawakens
Figure: High flaring event at Freeport LNG terminal on Feb 4, 2023
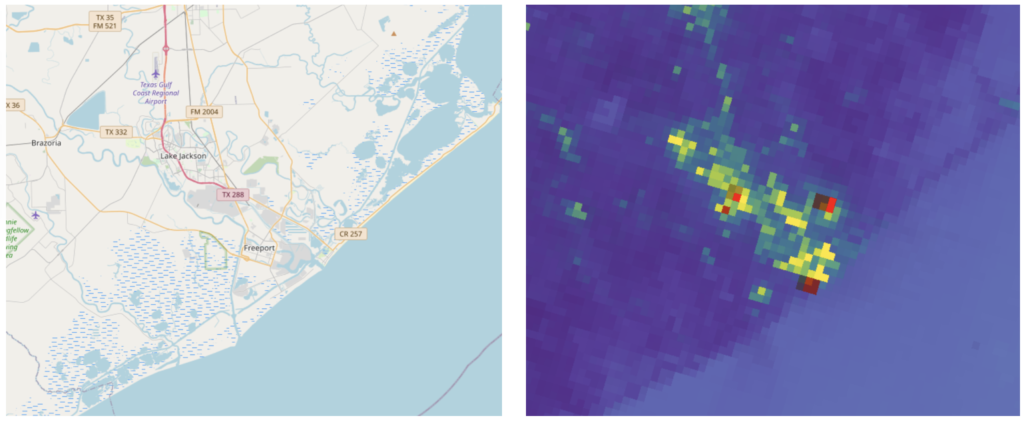
On the image on the right from the VIIRS satellite, red pixels represent heat spots, yellow and green pixels man-made light pollution, and blue represents the ground. The map on the left shows the plant’s location.
On Feb. 4, Kayrros LNG satellite monitoring picked up signs of life at the long idled Freeport LNG terminal near Freeport, Texas.
- The giant plant, with 15 MTPA (2.2 Bcf/d) of capacity, is the second largest in the US and the seventh largest in the world, accounting for 20% of US LNG exports. It had been shutdown by a fire and explosion on June 8.
- With global LNG markets tightened by the loss of Russian supplies following the invasion of Ukraine, the plant’s return had been eagerly anticipated but repeatedly pushed back since August.
- On Feb. 4, Kayrros noticed a high flaring event at the terminal at 07:42 UTC, one of several signs of life.
Gas flows into the plant resume
Figure: Weekly feedgas nominations to Freeport LNG January 2022 – February 2023
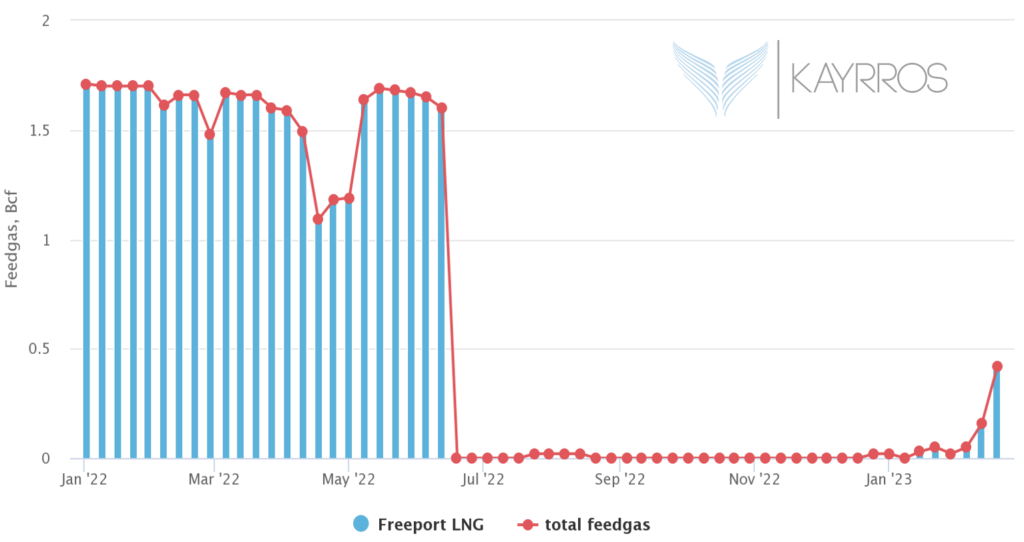
Following the flaring event on Feb. 4, feedgas nominations into the Freeport LNG plant resumed, signalling the restart of operations after a 7-month hiatus, Kayrros monitoring reveals.
- The plant’s restart is bullish news for the US domestic gas market, as the prolonged outage had backed out large volume of US production into the domestic market, putting downward pressure on domestic markets.
- Conversely, the resumption of activity at the plant points to significantly larger international LNG supplies and additional downward pressure on LNG prices, which had already been weakened by a late start of winter and reduced demand from European energy-intensive industries.
Relief for LNG importers
Figure: Weekly Europe LNG import volumes
The restart is welcome news for European consumers which have grown more dependent on LNG imports since the invasion of Ukraine and the loss of Russian gas supplies.
- Indeed, exports from Freeport LNG resumed ahead of the plant’s restart, as the operator emptied storage tanks to make room for new production.
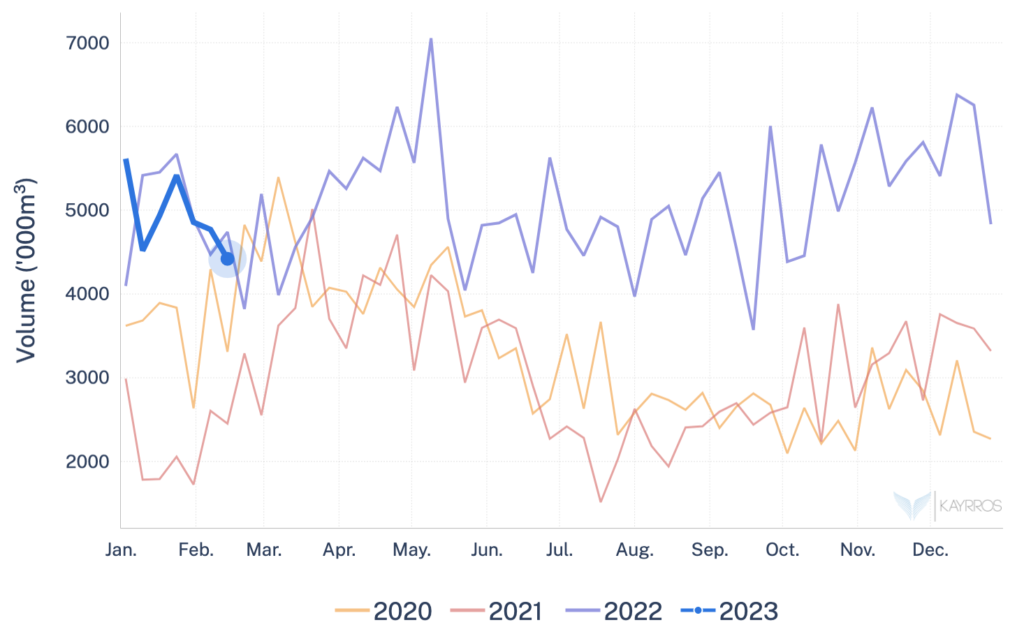
US exports set to rise
Figure: Weekly US LNG export volumes January 2021 – February 2023
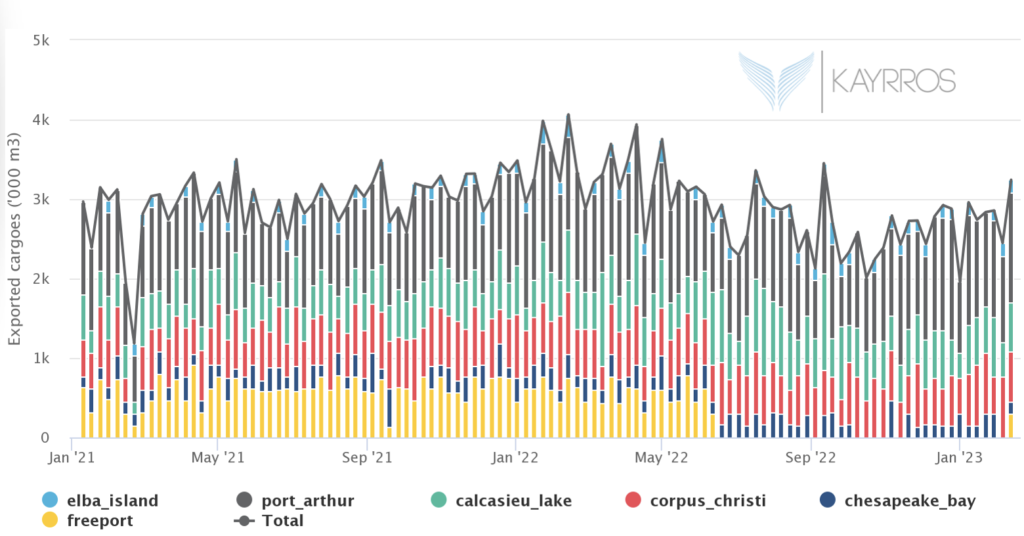
Freeport’s restart points to a further hike in US LNG exports, which have surged since the shale gas revolution.
- US exports rose in the first half of 2022 following the invasion of Ukraine and the loss of Russian supplies, averaging well over 3 million cubic meters per week. They fell back below that level in the second half the year following Freeport’s accident.
Uncertain outlook
Figure: Global LNG liquefaction-train utilization rates (weekly)
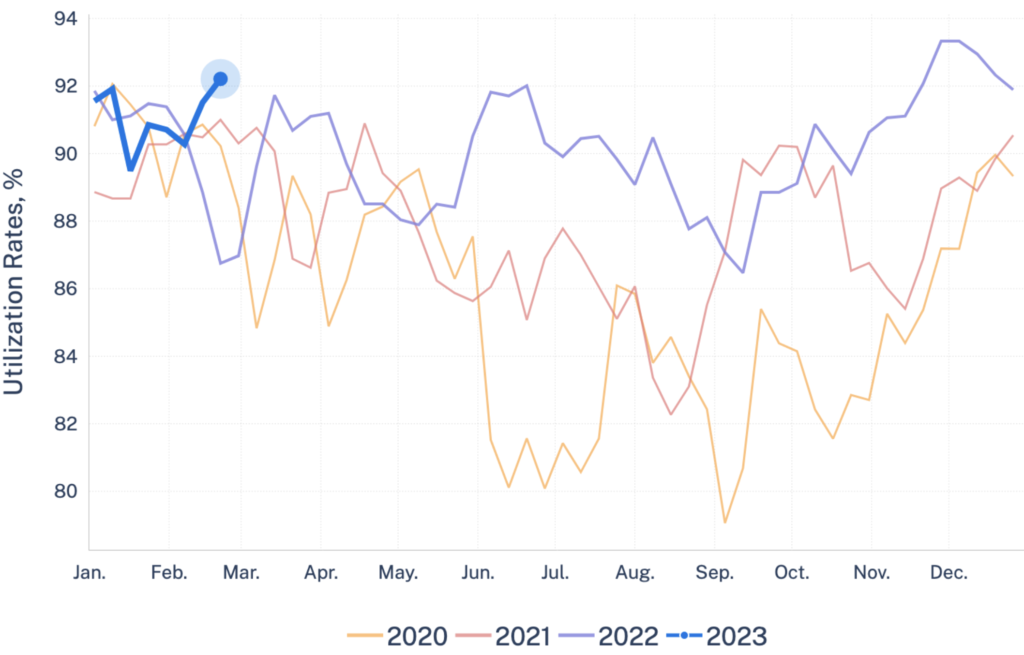
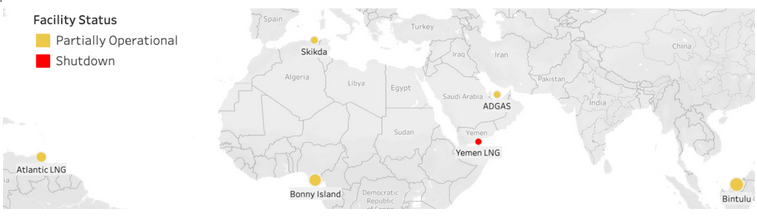
Figure: Map of the liquefaction plants with ongoing outages
While the restart of Freeport is clearly welcome relief, the European gas market remains highly uncertain.
- Kayrros data show outages and unplanned maintenance are commonplace among LNG liquefaction facilities worldwide, with some plants more prone to accidents than others.
- Indeed, we find that 32% of the world’s LNG plants, accounting for 55% of global liquefaction capacity, experience unplanned outages more than five times a year for a total of 90 days per facility on average.
- This represents an average total production loss of 2 MM㎥ per facility per year, or 27.4 MM㎥ globally per year.
- These on-and-off operations a major source of market and price volatility, all the more so in an already tight market.
- This supply uncertainty is just one of the wild cards facing the European gas market, along with Chinese LNG imports, the increased frequency of extreme weather, the outlook for the war in Ukraine and the state of Europe’s economy ands gas-intensive industries. All the more reasons to closely monitor LNG activity in real-time via satellite imagery.