Discover Kayrros ERCOT Impact Monitor at ERCOT Market Summit ➝ Get the most timely and accurate information on capacity additions to the grid, with cutting-edge satellite imagery and AI.
///
Make better decisions on
energy and the environment

Kayrros satellite-based technology independently measures the footprint of human activity on the environment at a global level
///
Science, AI and realtime satellite imagery transform global climate governance
///
Kayrros serves industries that need independent, accurate and reliable intelligence to succeed

///
Proprietary algorithms deliver accurate and actionable data streams at the lowest possible cost
Accuracy
Coverage
Largest mapped database of
millions of industry assets and
natural ecosystems
Value
Accuracy
Coverage
Largest mapped database of
millions of industry assets and
natural ecosystems
Value
///


///


///

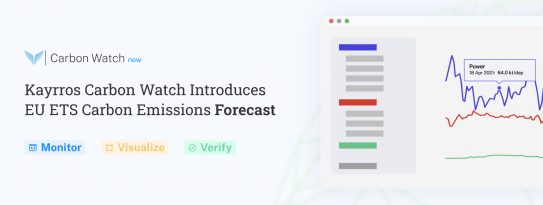
Kayrros Carbon Watch introduces EU carbon emissions forecasts

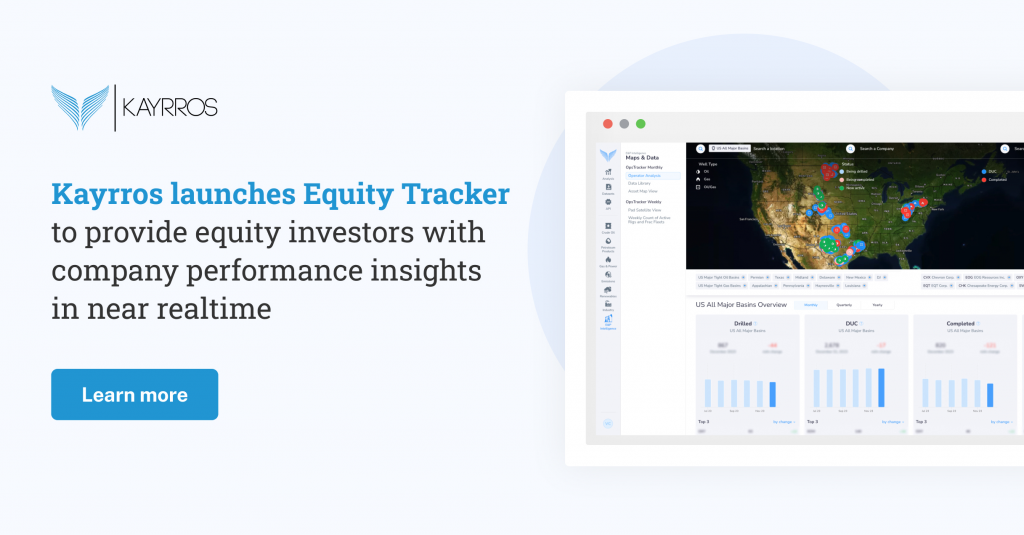
Kayrros launches Equity Tracker to provide equity investors with company performance insights in near realtime

KAPSARC and Kayrros Unveil Saudi Arabia’s Methane Emission Landscape Using Satellite Technology

Global Methane Pledge signatories failing in bid to cut emissions by 30% by 2030, Kayrros data shows